
Decoding The Endings Of Crypto Macro Cycles
What's behind the blow off top endings and will this happen again?


Highlights
The introduction of ETFs may influence volatility, not just by reducing percentage swings but also by altering the time span of these swings. Events like ETF launches can serve as significant, long-lasting support levels for prices.
Crypto markets remain heavily driven by sentiment and it’s impact on volatility should be monitored closely.
The BTC market cap dominance and gold price movements can provide valuable insights into the cyclical nature of cryptocurrency markets. Observing shifts in BTC dominance alongside gold's price action can help anticipate major market transitions.
In hindsight, the previous macro cycles of crypto look obvious. Absurdly high momentum indicators, divergences, breaks of structure, talking heads on the news - the list goes on. We must realize that each cycle likely may be similar but it does not have to happen the same way again.
Let’s look at a few historical relationships we can use as tools to guide us.
Will Bitcoin Become Less Volatile?
If Gold is any form of indicator here, the short answer is possibly, but not in the way people might think. If we look at peak to trough of the past two major Gold macro cycles, between 1980 and 1999 gold lost around 70% of its value pre-ETF (Exchange-Traded Fund) and between 2011 and 2015 lost 45% of its value post-ETF. An argument could definitely be made that this 25% difference in range from high to low shows the ETF inflows make it less volatile, however, another interesting variable here is time. The 1980-1999 downturn lasted 19 years while post ETF launch was only 4 years. This shows we should maybe look less at the percentage volatility but the percentage in combination with time. Market dynamics happen faster now and institutions can also play the cycles. Don’t be fooled.
Additionally, as long as crypto remains extremely sentiment driven this would be hard to see happening.
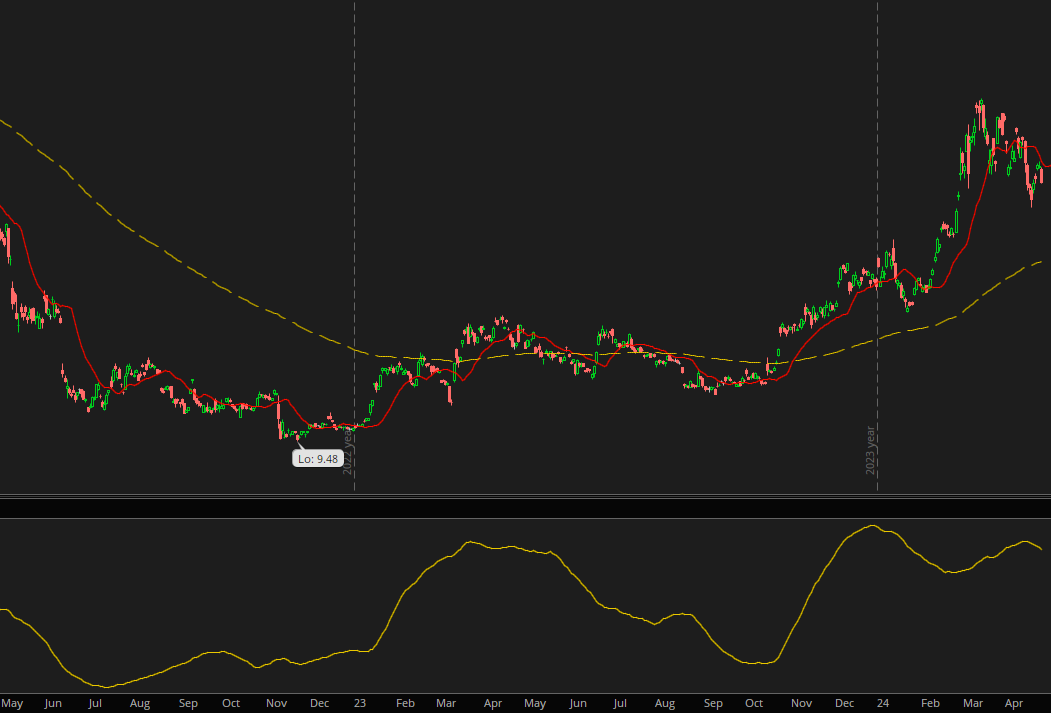
See the above chart of BITO (we’ll choose the futures ETF since it’s longer standing than the spot ones) compared to the bottom line which is average sentiment. The correlation is almost 1:1 with price movements.
Post Spot ETF Price Action
Why fixate on the ETF launch? Typically major events in crypto tend to have extreme long term effects depending on where we are in the overall cycle. Let’s take a second to look at the price action post spot ETF launch for both Gold and BTC.
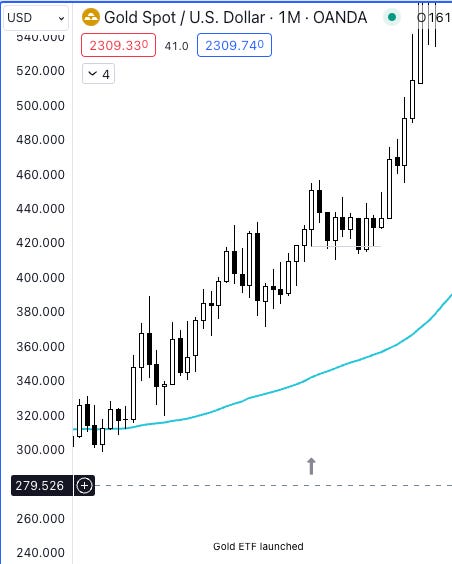
vs. BTC
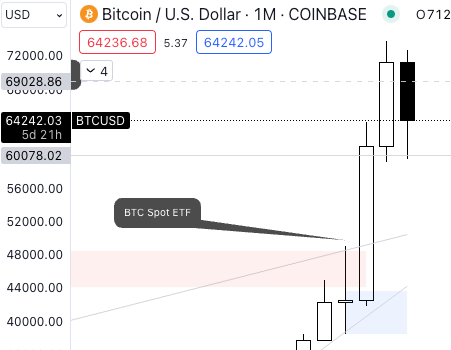
Both show that the monthly candle around the ETF launches served as price support. While pullbacks followed immediately, they were short lived. Keep this in mind and let’s look at BTC ETF inflows next.
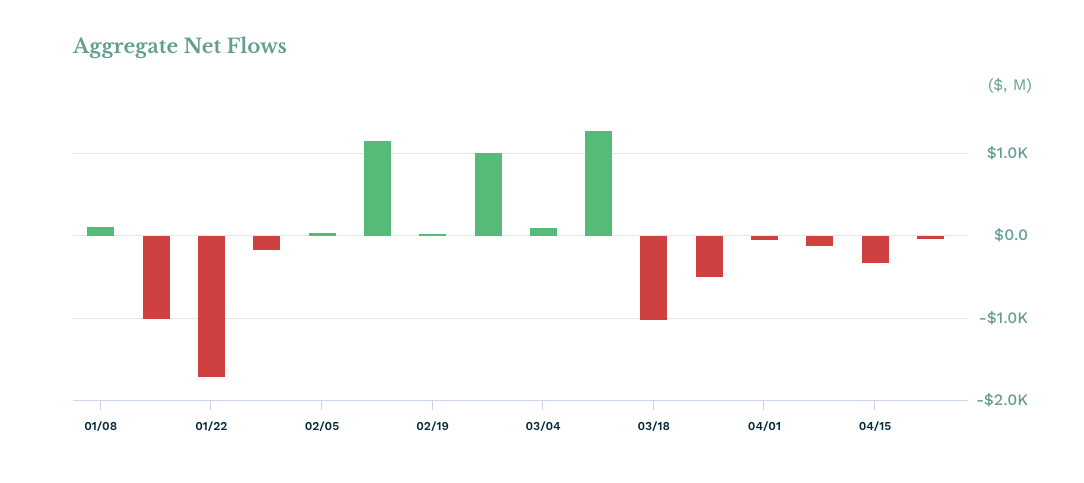
This chart shows the weekly net flows for IBIT vs GBTC. The reason for this is that a lot of entities sold GBTC to buy IBIT and other products, so we want to eliminate that skew as much as possible. Let’s focus between 2/5 and 3/18 on the net buying.
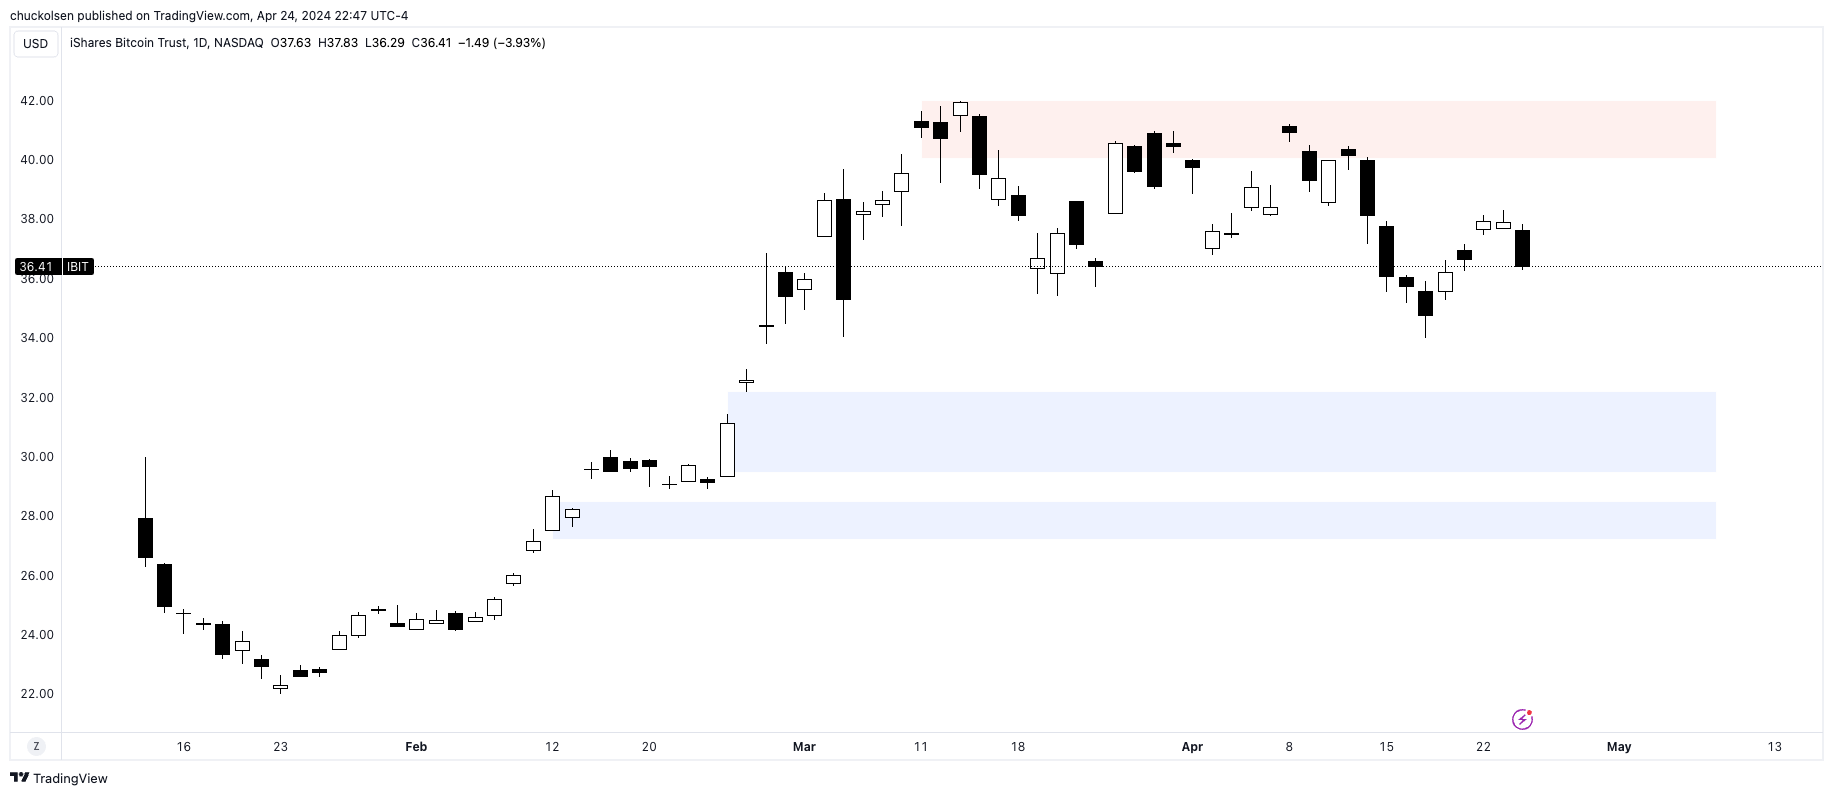
Highlighted on this chart of IBIT are the levels of those three weekly net inflows. If you’re a contrarian, you can look at large net flows (say >$1B) as potential reversal points. If you’re not, it can be signs of trend continuation. We’ll view these simply as levels of high activity that price could react at. For example, someone who bought on 3/11 (red box) is currently underwater on their position but may look to add at either of the bottom two levels (blue boxes) to lower their cost basis, where someone who bought at the lower levels could be looking to defend their entry price. These together could definitely be supportive of price and tie into the narrative of the Gold chart post-ETF.
The Importance of BTC Market Cap Dominance
BTC Dominance, which is essentially the percentage of BTC market cap comparatively to other cryptocurrencies, is important because it gives indication to where we might be in the cycle. Typically the cycle is as follows:
BTC
ETH
Altcoins
This is basically due to the flow of money from BTC profits into ETH, and those profits into smaller cap Altcoins. If BTC Dominance drops sharply it can indicate an end of a cycle as money flows to other projects, increasing their market caps comparatively and FOMO mania ensues. Over time BTC Dominance is likely to trend downward as the sector progresses, the key difference being the severity of the drop-off to indicate the possible cycle end.
Using BTC Dominance and Gold To Time Cycle Tops
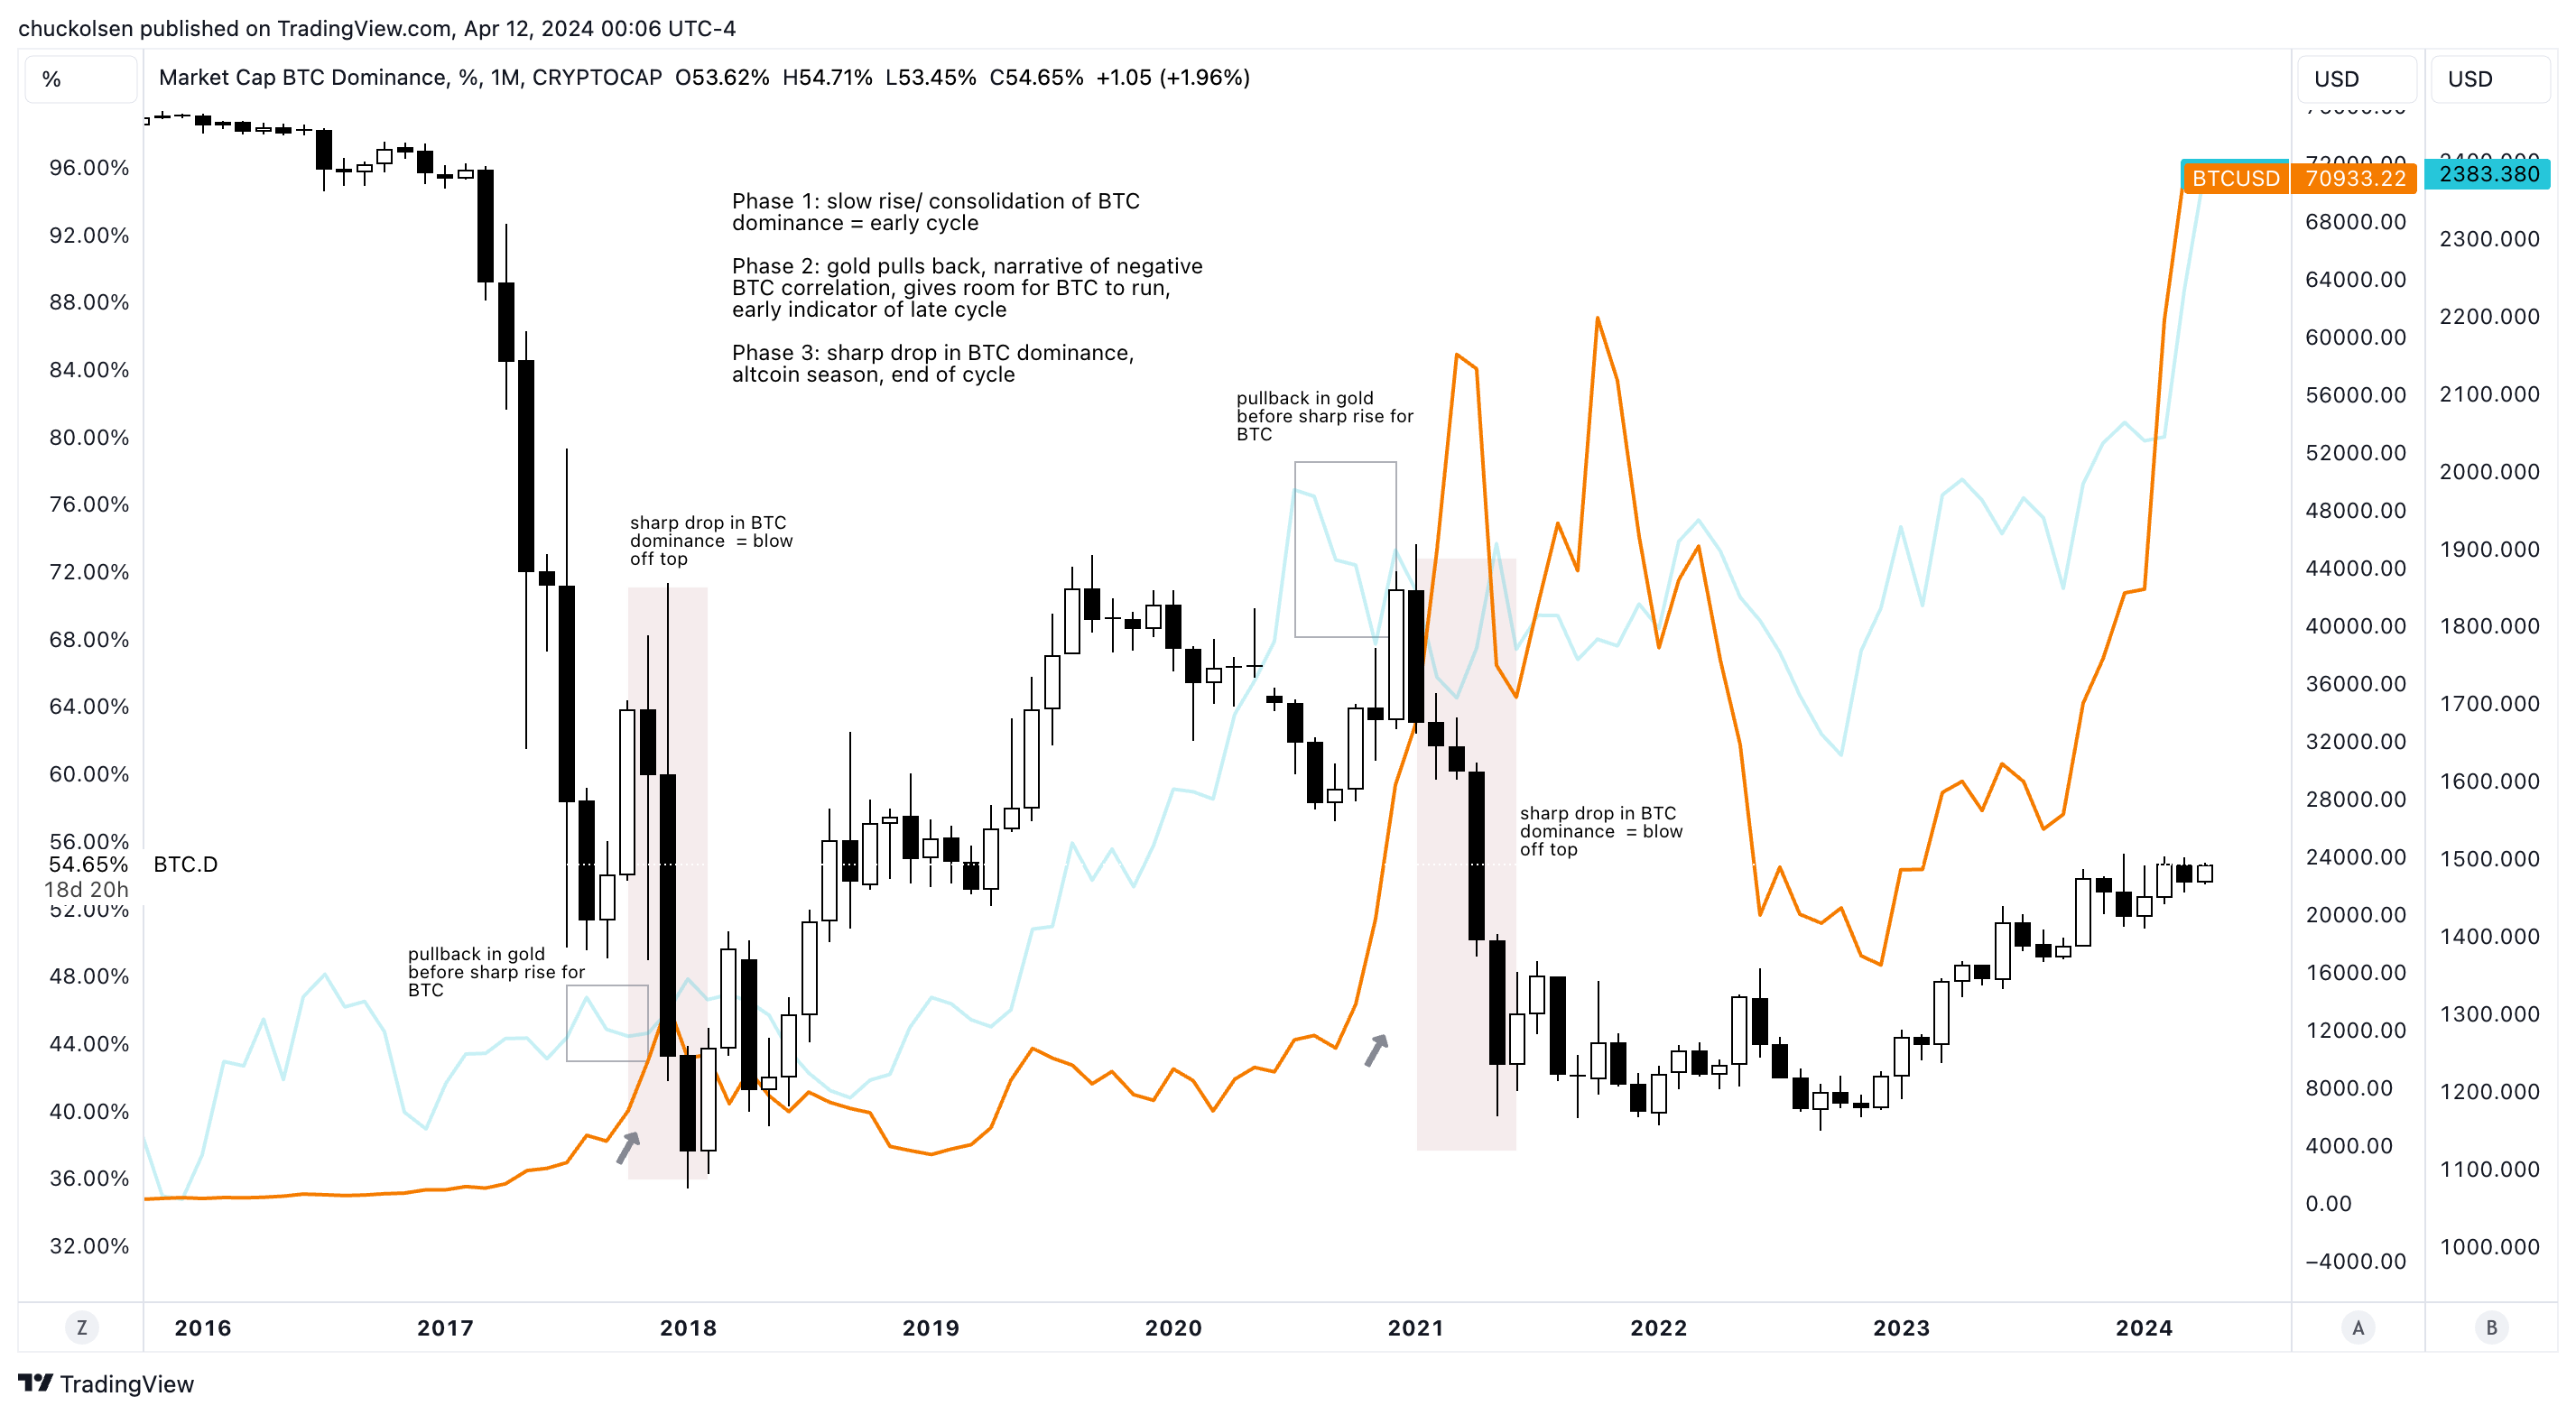
As stated above, BTC Dominance can give us a gauge of where we’re at in the cycle in relation to the level of buying of other cryptocurrencies. An interesting observation can also be made with Gold price action before market cycle tops. You can see that in both 2021 and 2018 gold experienced a strong pullback before BTC Dominance sharply dropped, marking the end of the Bitcoin cycle.
Using that, we can generally break down the full cycle into three phases:
Keep reading with a 7-day free trial
Subscribe to Daily Intuition to keep reading this post and get 7 days of free access to the full post archives.